Today we had a talk with Max Galka, an entrepreneur and blogger, whose primary focus is on the world of data and visualizations. He was full of easy tips and suggestions on how you can start to collect data to create infographics.
As a quick recap, Max discussed the differences between Data Visualizations and Infographics. And while they are more similar than they are different, they both require you to collect data and information!
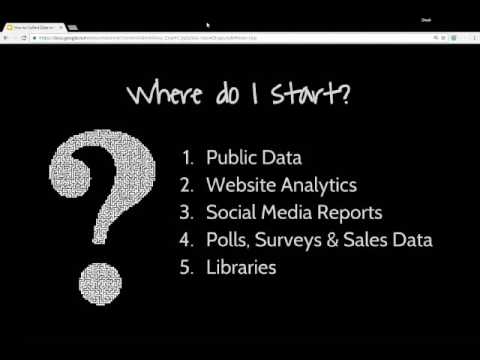
Depending on your goal and information you are trying to share, he suggested 5 places to start when looking to collect data:
Public Data
Website Analytics
Social Media Reports
Polls, Surveys, and Sales Data
Libraries
He also provided some tips on getting started with Data Analysis:
Check if source is reliable (and attribute it properly!)
Vet the conclusions you’re drawing from the data
“Correlation does not imply causation”
Let the data speak for itself
Easel.ly would like to extend a big THANK YOU to Max for taking the time to talk with us and I hope you found it informative!
Max Galka Resources:
http://metrocosm.com/
https://blueshift.io/
https://foiamapper.com/
Data Visualization Resources & Learning Tools